Analytics Logs
The analytics logs provide detailed information about web activity across your district, allowing you to review the content accessed by users and assist with troubleshooting.
Web Logs
DNS Logs
Important
The default time range for displayed logs is the last 24 hours. To adjust the time range, click the  button in the top right corner of the screen and select a preset or custom time range.
Tip
You can filter through the logs to search for specific entries by clicking the Magnifying Glass icon in the top right corner of the screen. If you need help filtering through analytics logs, refer to the Filtering Analytics section.
Click Insights from the Main Menu, then click Web Analytics from its sub-menu. The Web Analytics screen appears.
Click the Waffle icon in the top left corner of the screen. A menu appears beneath the title bar.

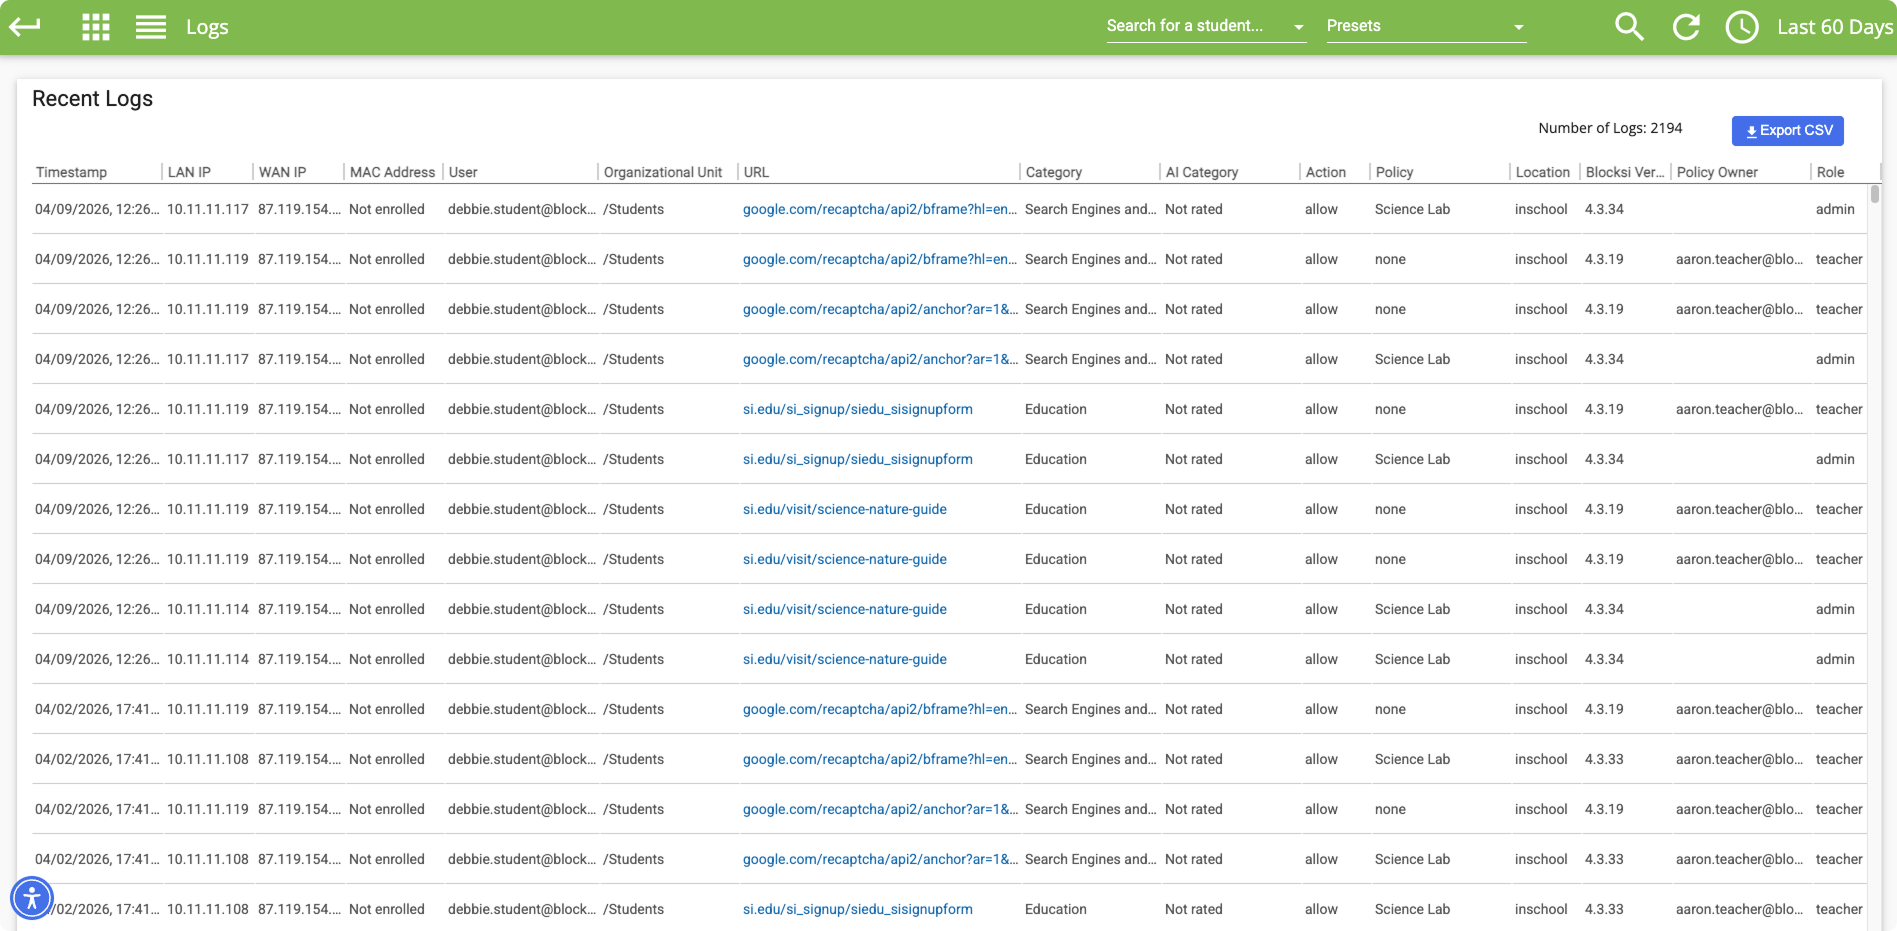
Click Logs. The logs display the following information:
Timestamp - The date and time at which the action occurred.
LAN IP - The LAN IP address of the device.
WAN IP - The WAN IP address of the device.
MAC Address - The MAC address of the device.
User - The user who initiated the action.
Organizational Unit - The organizational unit the user who initiated the action belongs to.
URL - The URL of the website that was accessed.
Category - The category of the website that was accessed.
AI Category - The category of the website that was accessed according to the AI Context Filter.
Action - The action that was taken. Valid entries are: Allow, Block, and Warn.
Policy - The policy under which the action occurred.
Location - The location at which the action occurred. Valid entries are: In School and Out of School.
Blocksi Version - The version of the Blocksi extension installed on the user's device at the time of the action.
Policy Owner - The email address of the policy owner. This field is blank if the policy owner is an administrator.
Role - The role of the policy owner.
Important
The default time range for displayed logs is the last 24 hours. To adjust the time range, click the button in the top right corner of the screen and select a preset or custom time range.
Tip
You can filter through the logs to search for specific entries by clicking the Magnifying Glass icon in the top right corner of the screen. If you need help filtering through analytics logs, refer to the Filtering Analytics section.
Click Insights from the Main Menu, then click Web Analytics from its sub-menu. The Web Analytics screen appears.
Click the Waffle icon in the top left corner of the screen. A menu appears beneath the title bar.
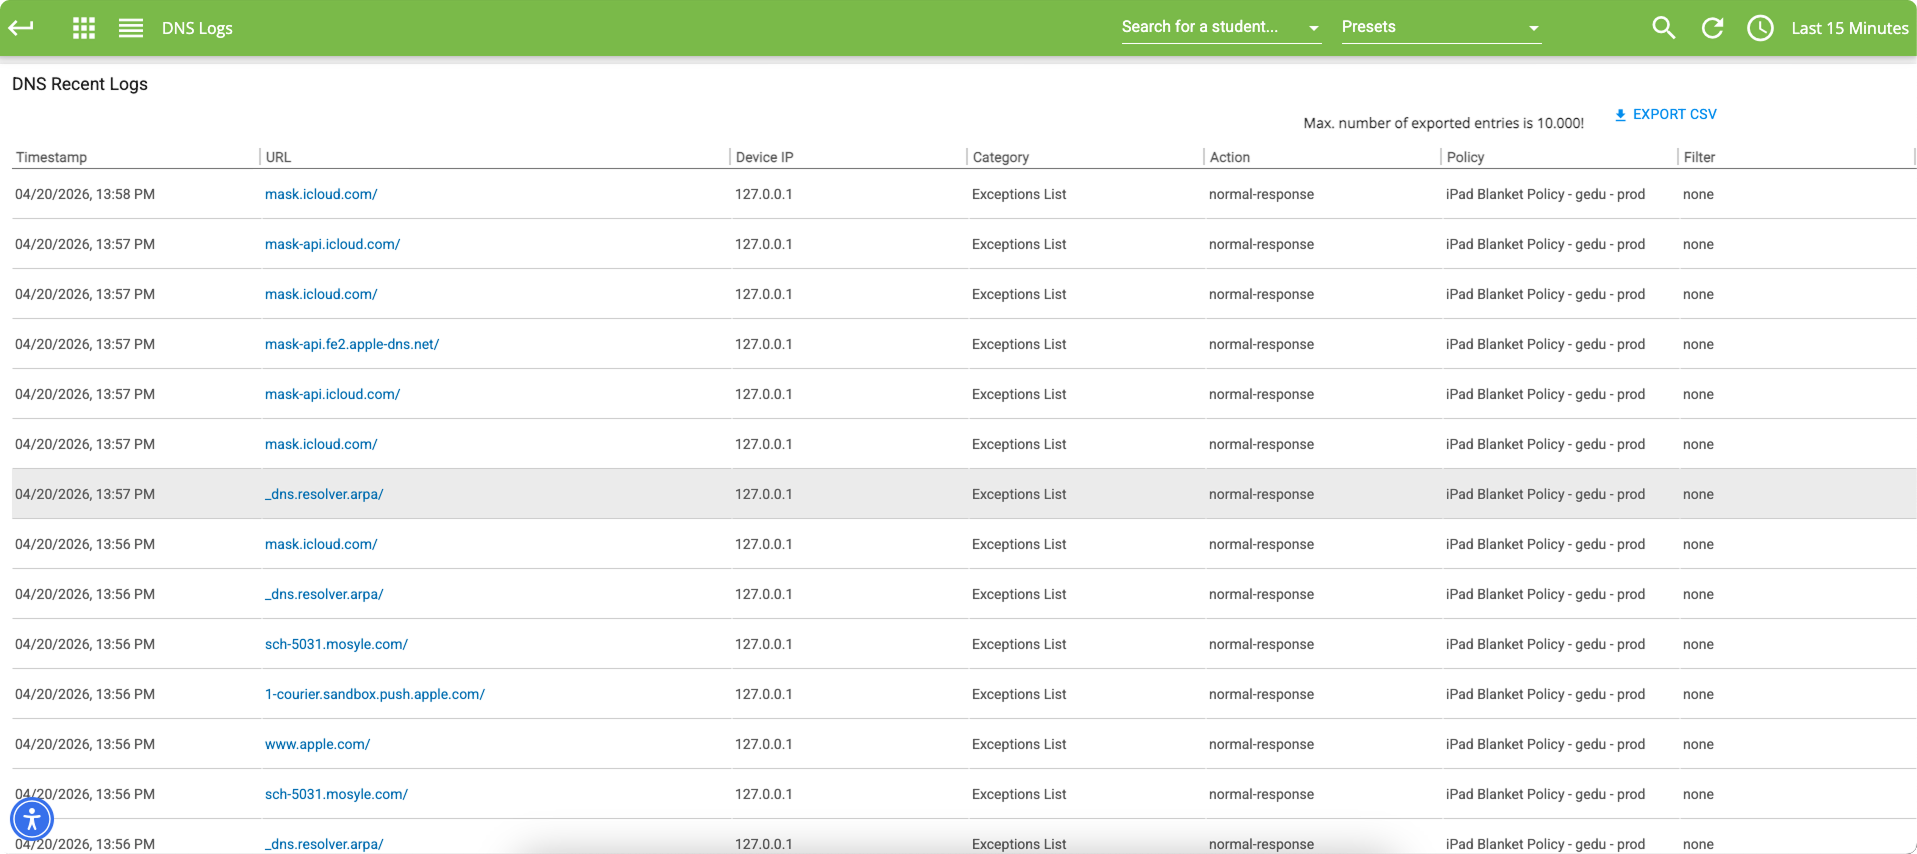
Click DNS Logs. The logs display the following information:
Timestamp - The date and time at which the action occurred.
URL - The URL of the website that was accessed.
Device IP - The IP address of the device.
Category - The category of the website that was accessed.
Action - The action that was taken. Valid entries are: Normal Response, Safe Search, Blocked.
Policy - The policy under which the action occurred.
Filter - The filter under which the action occurred.