Insights
Use Insights to track students' behavior with Web and YouTube analytics.
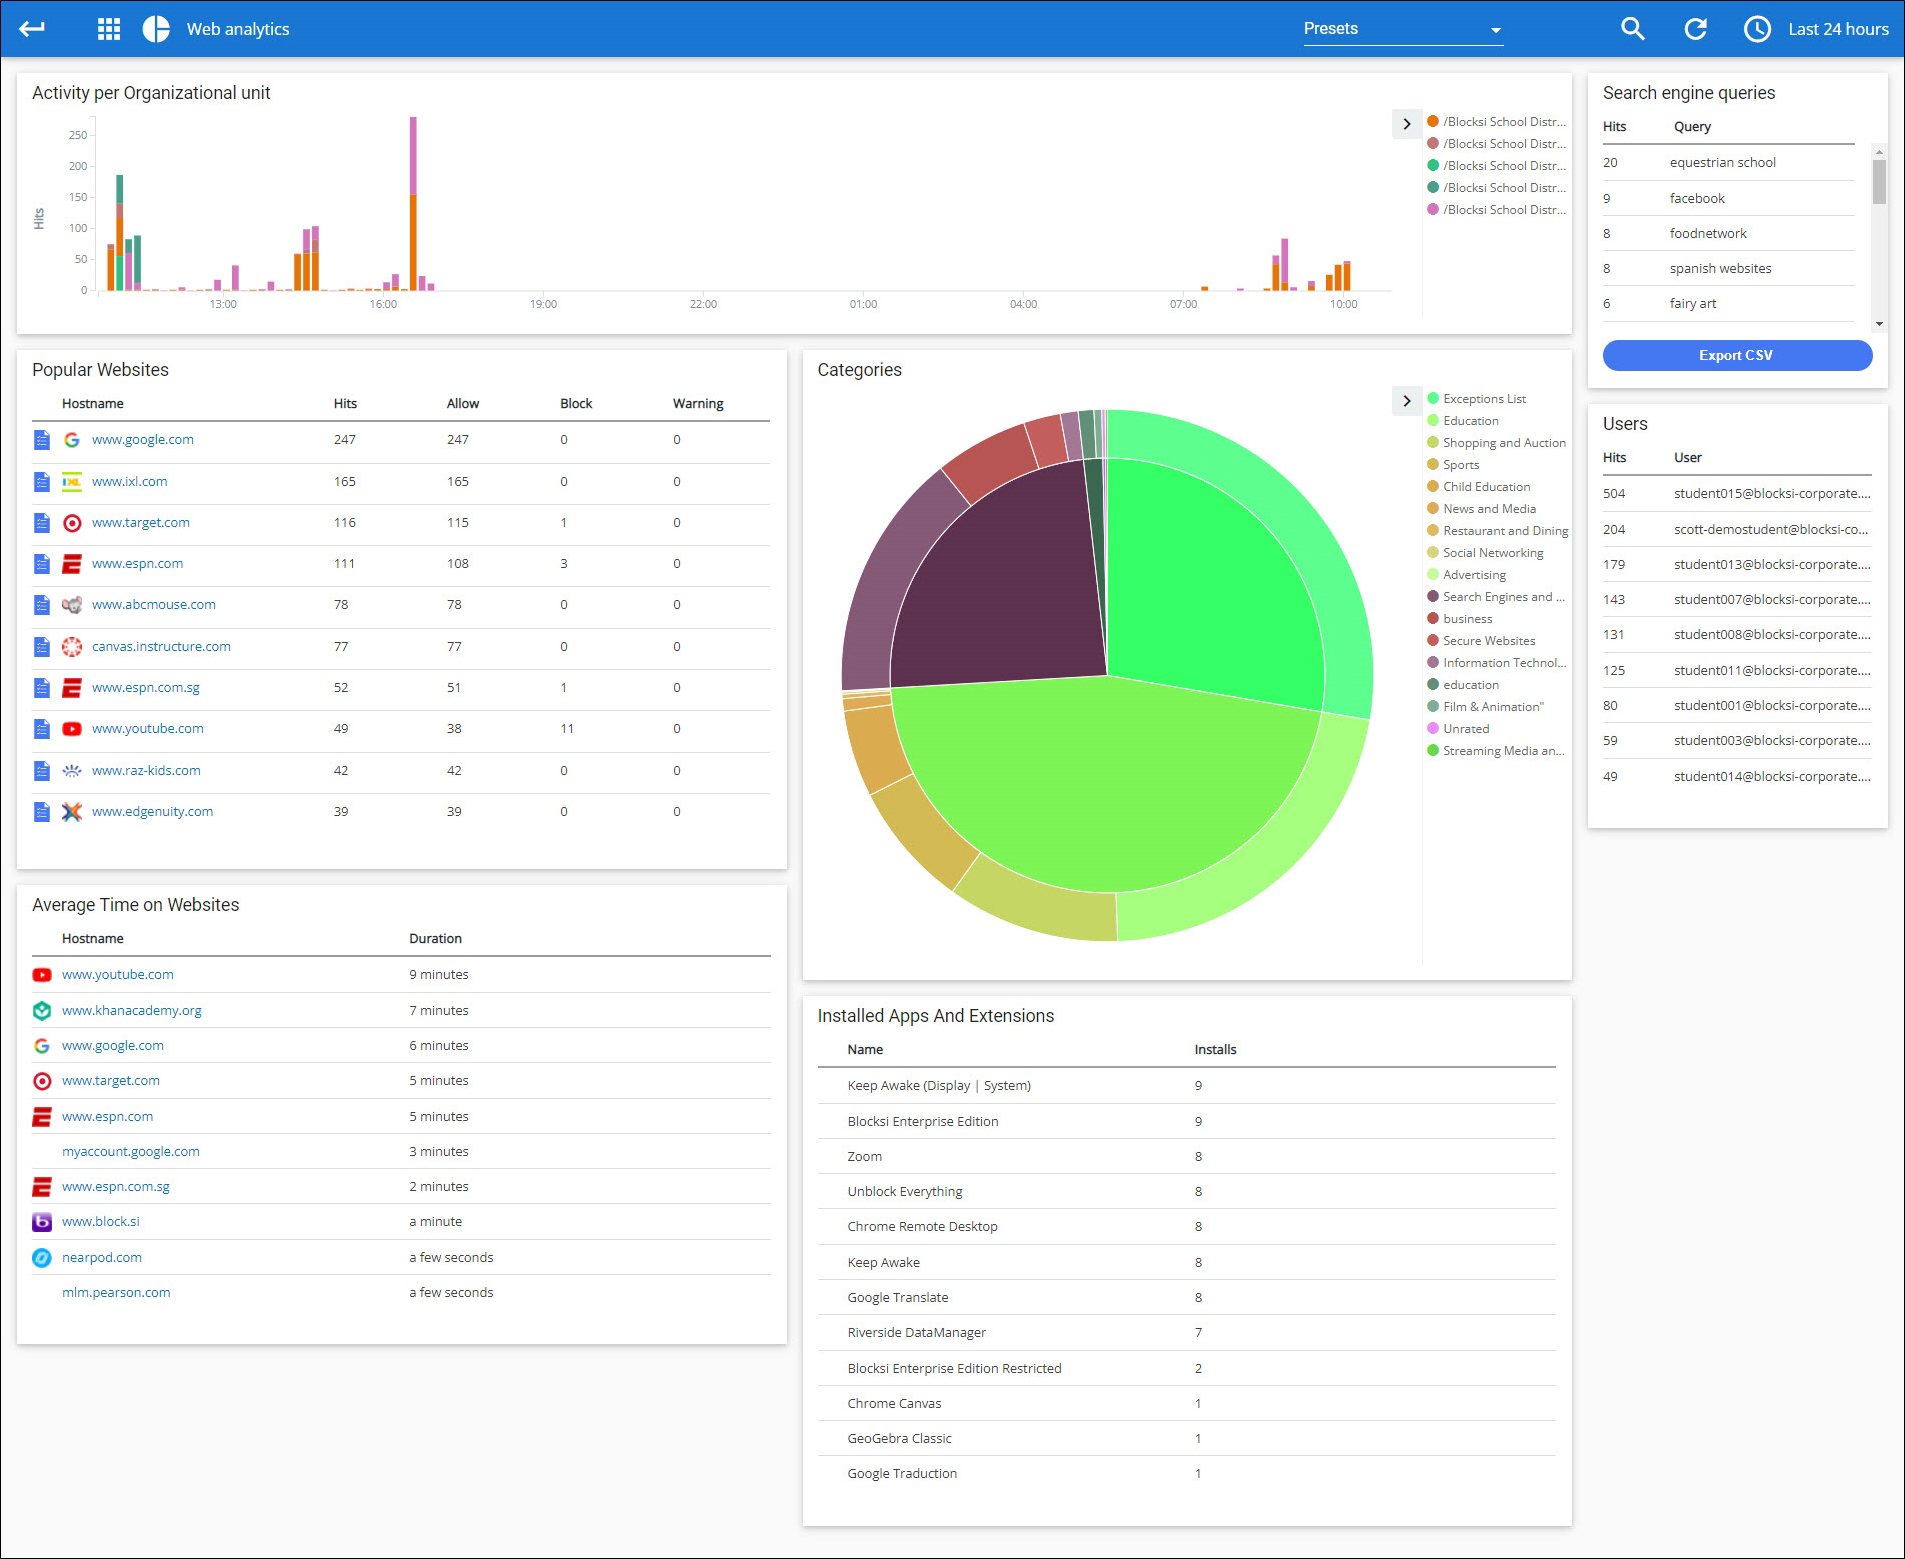
Activity Per Organizational Unit - Shows the amount of activity for each organizational unit (OU) in the district. The data are arranged in the chart according to the timeframe selected on the Web Analytics screen. Each color represents one OU. Hover over each bar on the chart to see the OU, the date and time at which the data was pulled, and the number of requests. Clicking one of the bars changes the data on the screen to that specific OU. See Filtering Analytics for more information.
Popular Websites - Gives the number of times the most popular websites were visited, including whether they were allowed, blocked, or provided a warning. Click each website name to go to that website.
Average Time on Websites - Provides the average time spent on each of the included websites. Click each website name to go to that website.
Categories - Uses a pie chart to show the categories of the websites visited during the selected timeframe. Click each category to see the websites for that category. See Filtering Analytics for more information.
Installed Apps and Extensions - Displays the names of applications and extensions installed on users' accounts.
Search Engine Queries - Shows the terms used to search for websites and the number of times each was searched for. Click each term to see which websites it was searched on. See Filtering Analytics for more information.
Users (Students) - Shows the students included in the selected timeframe and the number of hits each has. Click each user's name to see the analytics for only that student. See Filtering Analytics for more information.
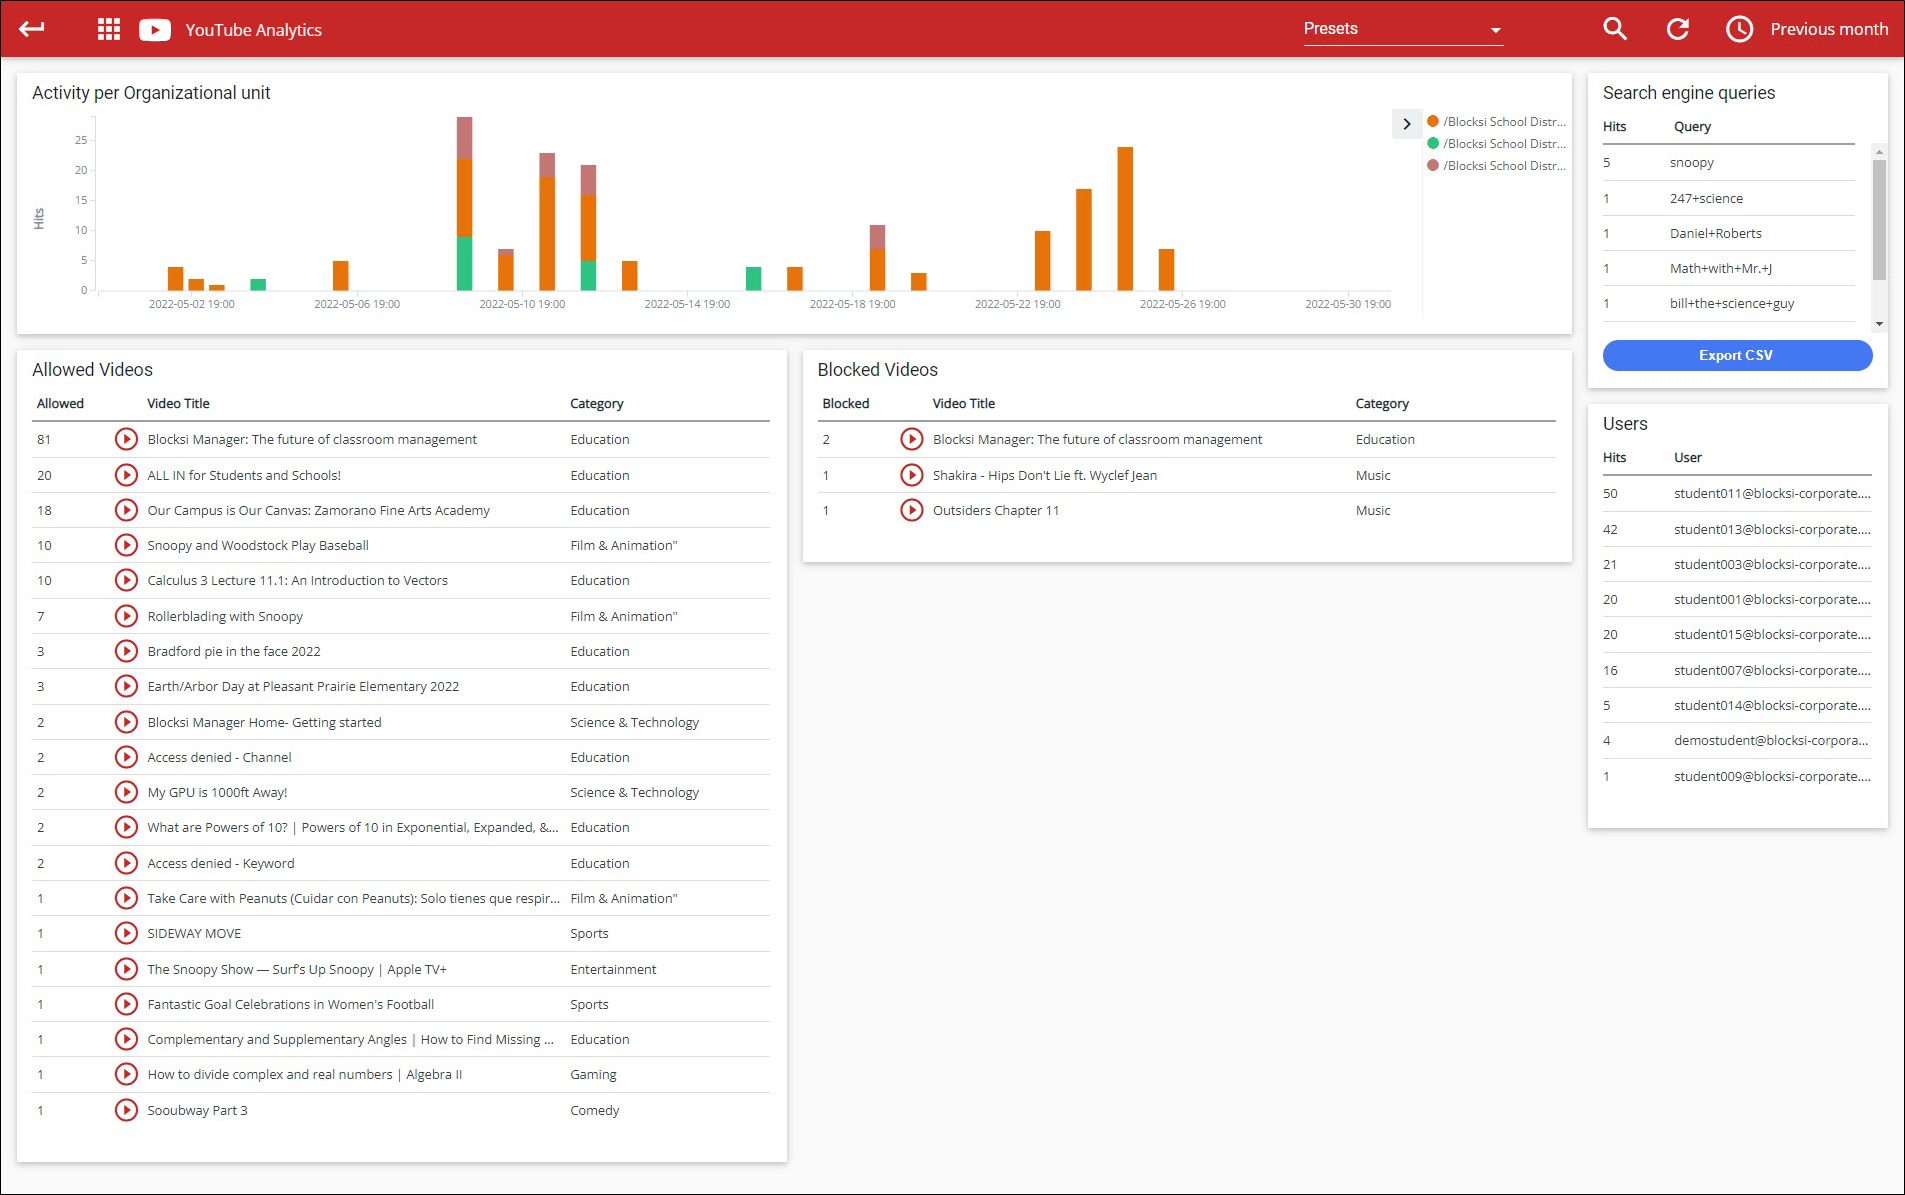
Activity Per Organizational Unit - Shows the amount of activity for each organizational unit (OU) in the district. The data are arranged in the chart according to the timeframe selected on the YouTube Analytics screen. Hover over each bar on the chart to see the OU, the date and time at which the data was pulled, and the number of requests. Clicking one of the bars changes the data on the screen to that specific OU. See Filtering Analytics for more information.
Allowed Videos - Gives the names of the videos allowed during the selected timeframe.
Blocked Videos - Gives the names of the videos blocked during the selected timeframe.
Search Engine Queries - Shows the terms used to search for websites and the number of times each was searched for. Click each term to see which websites it was searched on. See Filtering Analytics for more information.
Users (Students) - Shows the students included in the selected timeframe and the number of hits each has. Click each user's name to see the analytics for only that student. See Filtering Analytics for more information.
Click Insights from the Main Menu. The Web Analytics screen appears. The timeframe is located at the far right of the blue area at the top of the screen. The default timeframe is Last 24 hours.
Click the timeframe to change it. The blue area expands to include a range of various timeframes, as shown below. The Quick section includes preset timeframes. Click the Calendar section to choose the timeframe by month, week, and year, as shown to the right.
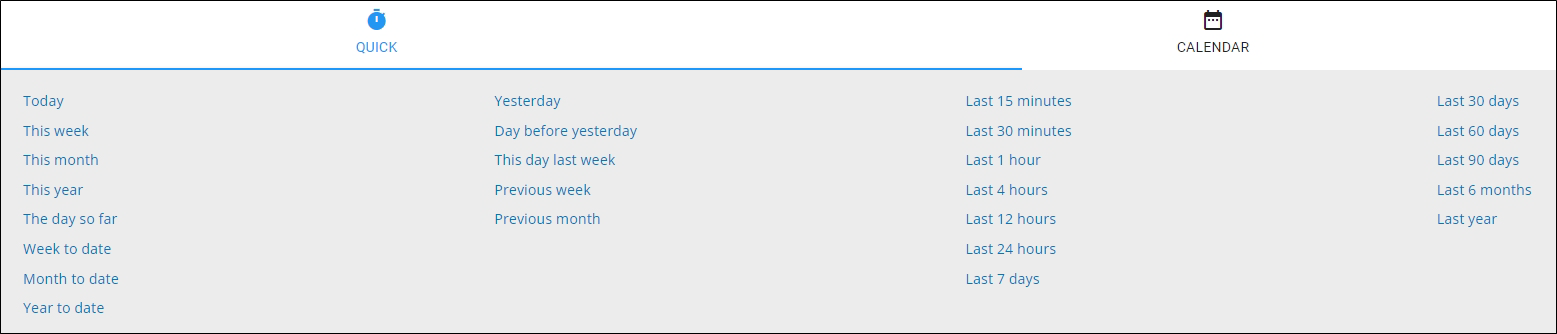
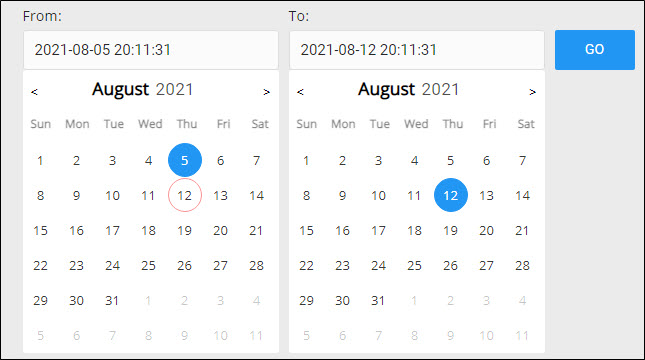
Click a timeframe to select it or select one from the calendar and click GO. The new timeframe appears at the far right of the blue area.
Click Insights from the Main Menu and then click the search icon at the top of the screen. The filter appears.
User - Search for a specific user's browsing activity | Class - Search for a specific class |
Organizational unit - Search for a specific organizational unit | Teacher - Search for a specific teacher |
Action - Values supported are Allow, Block, and Warning | Location - Search for a specific location |
Category - Search for a specific web category | Policy - Search for a specific policy |
Hostname - Search for a specific hostname | WAN IP - Search for a specific WAN IP address |
Path - Search for a specific path | LAN IP - Search for a specific LAN IP address |
Search Engine Queries - Search for specific queries |
Note
You can use only one instance of each of these filters.
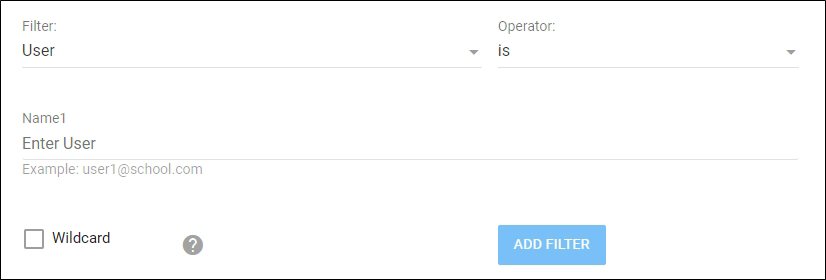
Select the filter to search on from the Filter drop-down list. When you select an option, the Name field and the Wildcard checkbox appear beneath the Filter list, as shown below.
Note
Blocksi uses the asterisk (*) as a wildcard to represent one or more unknown characters in a URL. Example: "www.google.*" matches "www.google.com" and "www.google.co.uk."
Select the operator from the Operator drop-down list. The operator is used to restrict the search to a particular value. For instance: if you select User in the Filter list, is not in the Operator list, and type student002 in the Name field, the filter will restrict the search results to all students other than student002.
Type the item to search for in the Name field.
Select the Wildcard checkbox if you include wildcards in your search. Selecting the checkbox is required if you use wildcards in your search.
Tip
The filter appears in red if you choose is not or is not one of operators; otherwise, the filter appears in green.
When you save a filter, it is saved as a preset filter. If you plan to search with the same filter often, it is best to create a preset so you don't have to select the filter each time.
Create a filter for Pornography. It appears on the Web Analytics screen along with two buttons, as shown below.
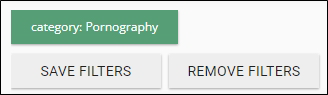
Click the SAVE FILTERS button to save this filter as a preset filter. The following window opens.
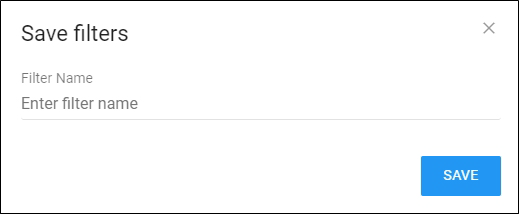
Type the name of the filter in the Filter Name text box and click the SAVE button.
To remove the filter: Click the REMOVE FILTERS button to remove this filter. This action does not delete the preset filter if you created one using this filter.
After you save a filter, it appears as a preset filter when you click the Presets drop-down list in the title bar, as shown below.
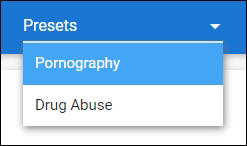
To select a preset filter: Click the desired preset filter from the list.
When you remove a preset filter, it is removed completely from the system.
To remove a preset filter: When you select a preset filter from the drop-down list, a trash can icon appears to the right of the preset filter, as shown below.

Click the trash can icon to remove the preset filter from the system.
Click Insights from the Main Menu. The Web Analytics screen appears.
Click Web Analytics from the top of the screen. A menu appears beneath the title bar.
Click LOGS.
The logs provide you with the following information:
Timestamp - The date and time at which the action occurred
Category - The category of the website or video that was accessed
LAN IP - The LAN IP Address of the device
Action - The action that was taken. Valid entries are allow, block, and warn
WAN IP - The WAN IP Address of the device
Policy - The policy that was effective when the action occurred
User - The user who initiated the action
Location - The location at which the action occurred. Valid entries are inschool and outschool
Org. Unit - The organizational unit in which the action occurred
Blocksi Version - The current version of the Blocksi extension installed on the user's device
URL - The URL of the website or video that was accessed
Download the analytics report, which contains information about Web and YouTube analytics, in CSV or PDF format.
Click Insights from the Main Menu and then click Web Analytics at the top of the screen. A menu appears beneath the title bar.

Do one of the following:
Click DOWNLOAD PDF. The file appears in the lower left-hand corner of your screen in PDF format. Click it to open and save it.
Click LOGS. The Recent Logs screen appears. Click EXPORT CSV in the upper right-hand corner of the screen. The Export CSV window opens.
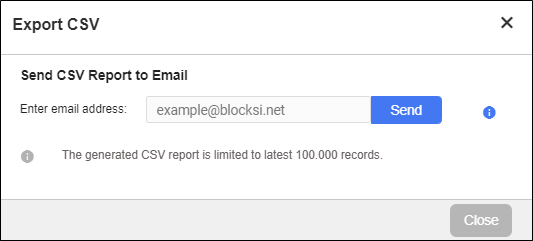
Type the email address in the text box and click Send. The CSV report is generated and sent to the email address you entered.
Download search engine queries in CSV format.
Click Insights from the Main Menu. The Web Analytics screen appears.
Click the Export CSV button in the Search Engine Queries section. The file appears in the lower left-hand corner of your screen in your spreadsheet program. Click it to open and save it.