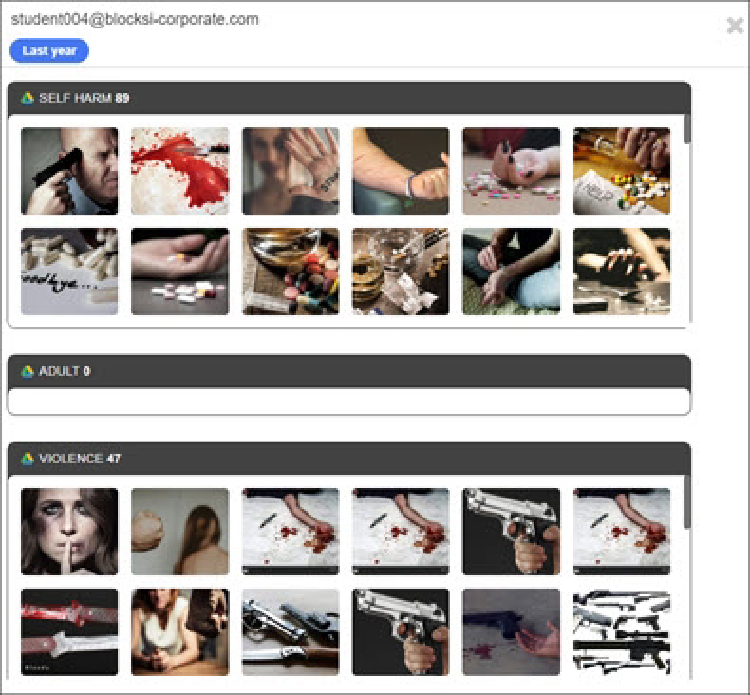
Areas of Concern
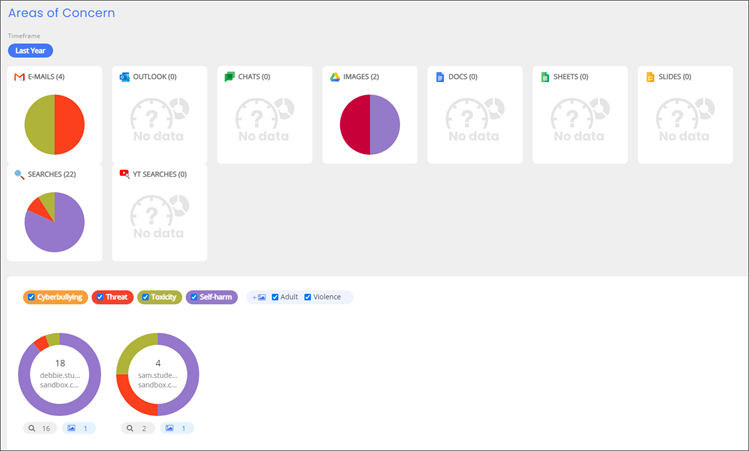
Areas of Concern displays a graphical representation of how your child has received or sent questionable material.
Google Emails
Outlook Emails
Google Chats
Google Images
Google Docs
Google Sheets
Google Slides
Web Searches
YouTube Searches
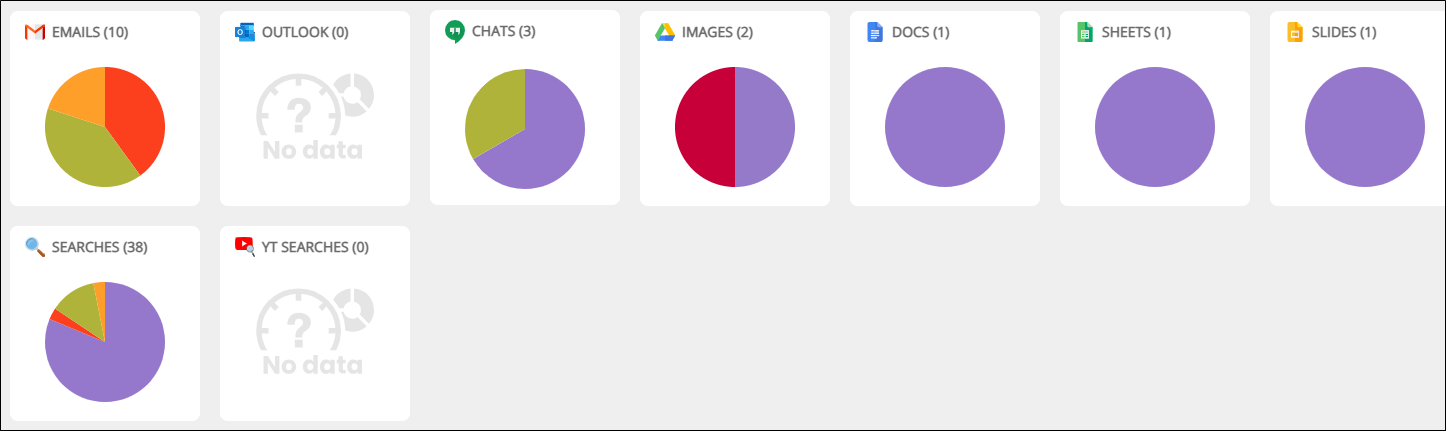
Hovering your mouse cursor over a portion of the pie chart displays the following information:
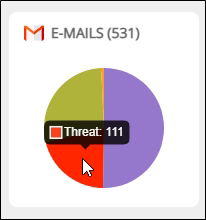
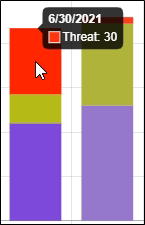
In this instance, there were 111 email threats during the selected timeframe. Threat is one of several classifiers used to identify the type of content.
Cyberbullying
Threat
Mental health
Adult Images
Images of Violence
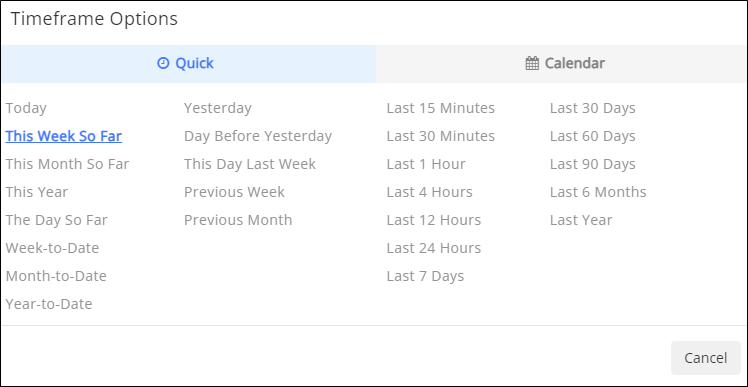
This section of the Areas of Concern screen shows the various timeframes to select when viewing student safety results. The highlighted selection is the current timeframe.
This section of the Areas of Concern screen shows the classifiers. What you select here changes the results accordingly.

Click Areas of Concern from the Main Menu. The Areas of Concern screen appears. Click an area on the image below to see a description of that area.
Click a different timeframe in the Timeframe section.
This section of the Areas of Concern screen shows the results for the selections you made. In this image, you can see that there are results for several children. These results show the number of emails, searches, and images for each child. Click inside or below each graph to see the emails, searches, and images for each child. Results are returned in reverse chronological order.
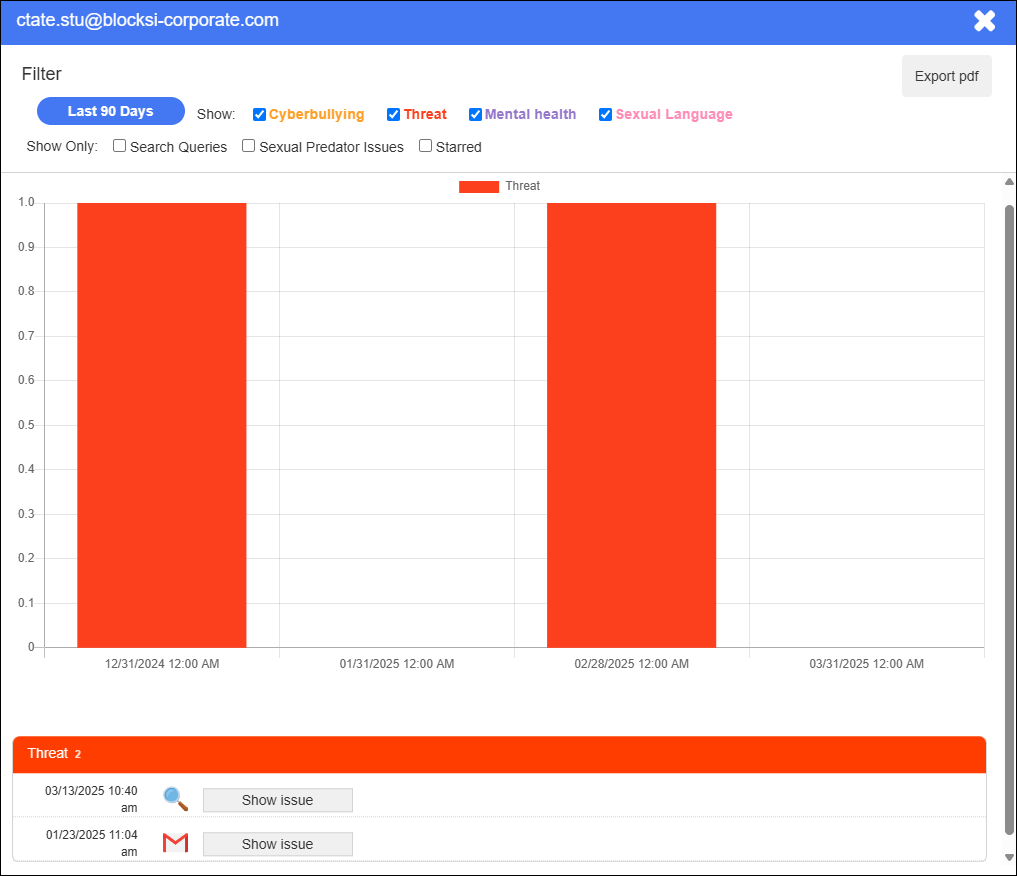
For example, clicking inside the graph opens a window that shows emails. Refer to the descriptions on the image.
Hovering your mouse cursor over each bar in the bar chart displays the data for that particular safety type, as shown below. Here you can see that there were 30 threat instances during June 2021.
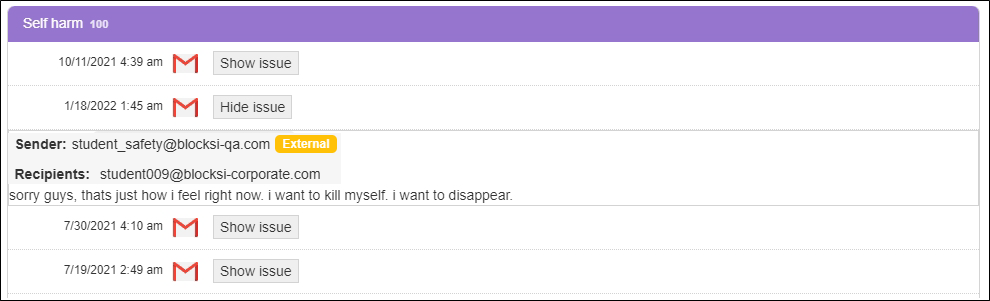
Clicking the Show Issue button for an email displays the contents of that email, as shown below.
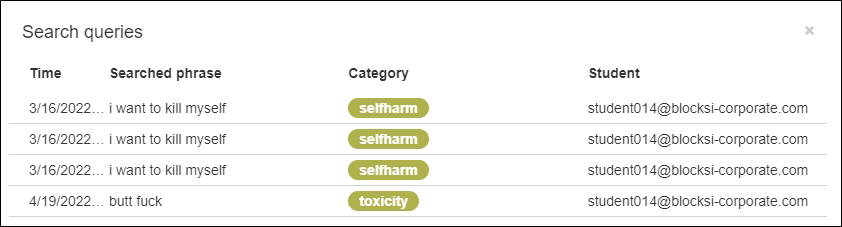
Clicking the search icon below the graph opens the following window.
Clicking the images icon below the graph opens the following window.